APIM Backend Fan-out: Shared Backend + rewrite-uri vs One Backend Per API (A Real Benchmark)
🎯 TL;DR: Shared
Backend+rewrite-uriis performance-equivalent to oneBackendper API.The question: if you point 100+ APIs at a single APIM
Backendentity and userewrite-urito reconstruct the path, do you pay a measurable latency / throughput / reliability penalty versus modelling oneBackendentity per API?Two identical APIM Premium instances, same Function App backend, same k6 load. Across 1.67M requests and ~32 minutes of stepped load (50 → 100 → 200 VUs): 882 vs 874 req/s, 146 vs 153 ms p95, 0 errors on both sides. All three pass/fail thresholds satisfied. Pick the pattern on operational simplicity, not performance.
Bonus finding: backend cold-scale will lie to you. The first run made the shared-backend pattern look 2× slower, that was Flex Consumption scaling up during APIM-A’s window, not a pattern difference. Always warm your backend before measuring.
Full benchmark, IaC, k6 scripts, KQL, and interactive dashboard: github.com/Ricky-G/azure-scenario-hub/tree/main/src/apim-backend-fanout-benchmark
Recently I ran into a scenario worth benchmarking properly: an APIM Premium estate with 100+ APIs that all ultimately call the same upstream service. The architectural choice is whether to model those APIs against a single APIM Backend entity and use rewrite-uri to reconstruct the right path on the way out, or to create one Backend entity per API. One backend is one thing to manage, one health probe, one circuit breaker, one place to flip URLs during a migration. One hundred is, well, one hundred.
Intuition splits cleanly down the middle on whether the shared pattern carries a hidden cost (connection pools are per-backend, surely?) or none at all (it’s just a string concat). I couldn’t find a clean controlled benchmark of this specific question, so I built one, fully reproducible in the Azure Scenario Hub. What follows is the methodology, the numbers, and the wrong answer the first run produced.
The Two Patterns
flowchart LR
    subgraph A["APIM-A · Premium 1 unit · SHARED backend + rewrite-uri"]
      A_API1[api-shared-01 /svc01/v1]
      A_API2[api-shared-02 /svc02/v1]
      A_APIn[...10 APIs]
      A_FRAG{policy fragment
set-backend-service
+ rewrite-uri}
      A_BE[(1 Backend entity)]
      A_API1 --> A_FRAG
      A_API2 --> A_FRAG
      A_APIn --> A_FRAG
      A_FRAG --> A_BE
    end

    subgraph B["APIM-B · Premium 1 unit · PER-API backend"]
      B_API1[api-perapi-01 /svc01/v1] --> B_BE1[(Backend 01)]
      B_API2[api-perapi-02 /svc02/v1] --> B_BE2[(Backend 02)]
      B_APIn[...10 APIs] --> B_BEN[(Backend 10)]
    end

    A_BE --> Func[(Same Mock Backend
Function App · 5ms baseline)]
    B_BE1 --> Func
    B_BE2 --> Func
    B_BEN --> Func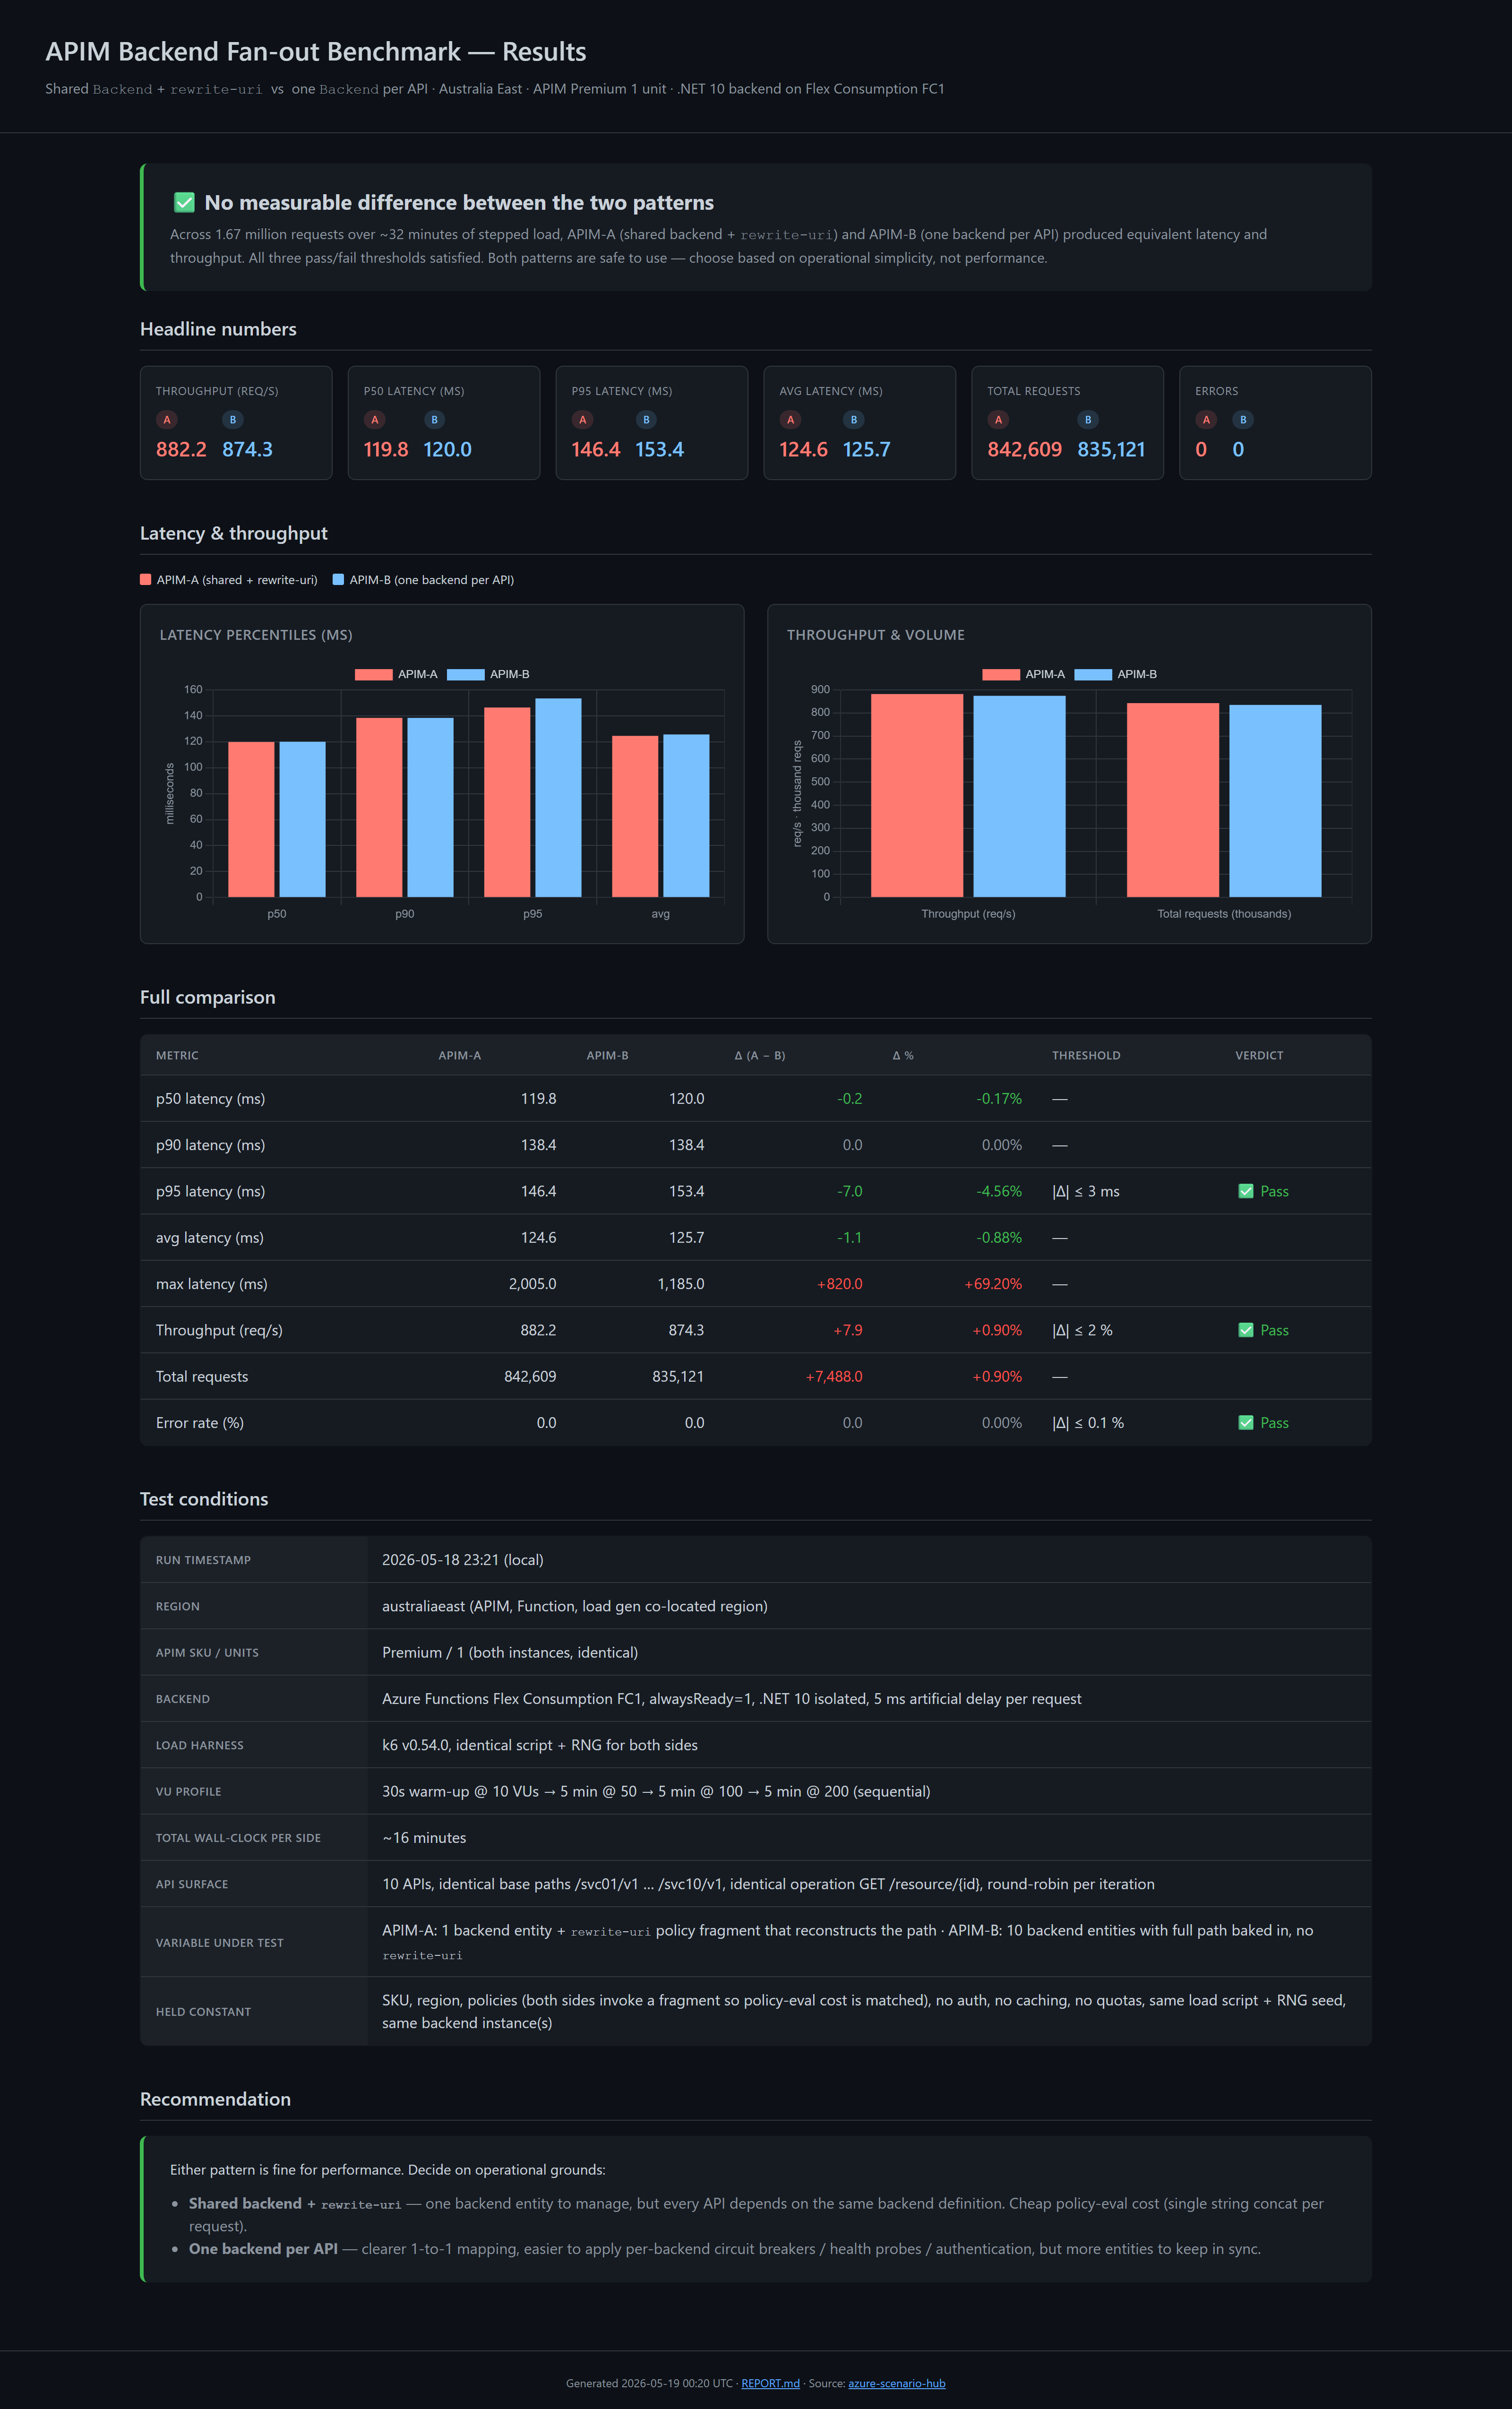
About the Azure Scenario Hub
This benchmark lives in the Azure Scenario Hub, an open-source collection of end-to-end, deploy-it-yourself Azure scenarios I maintain. Each scenario is a fully working slice of a real-world question: opinionated IaC (Bicep), runnable load harnesses, KQL queries, dashboards, cleanup scripts, and a write-up explaining what it proves. The goal is simple: when someone asks “is pattern A actually slower than pattern B on Azure?”, there should be a repo you can clone, deploy, and verify the answer in an afternoon, not a forum thread of opinions.
This post is the write-up for one such scenario, apim-backend-fanout-benchmark. The full IaC, k6 harness, KQL, and dashboard are in the repo, deploy and rerun instructions are at the bottom of this post.
If you find that valuable, please star github.com/Ricky-G/azure-scenario-hub; it genuinely helps surface the project for others hitting the same questions. PRs with new scenarios are very welcome too.
The Two Patterns in Detail
APIM-A (shared-backend pattern)
- 1
Microsoft.ApiManagement/service/backendsentity (shared-mock-backend), URL points athttps://<func>.azurewebsites.net/api/echo - 10 APIs, each at a unique base path (
/svc01/v1…/svc10/v1) - Every API uses a policy fragment that does
set-backend-service+rewrite-urito reconstruct the full path on the way to the backend:
1 | <fragment> |
APIM-B (one-backend-per-API pattern)
- 10
backendsentities, each pointing at the same Function App but with the full path baked in (/api/echo/svc01/v1,/api/echo/svc02/v1, …) - 10 APIs, same base paths as APIM-A
- Every API uses a policy fragment that just does
set-backend-serviceto its dedicated backend, norewrite-uri
Both sides invoke a policy fragment so the policy-evaluation cost is identical. The only variable is the rewrite-uri call.
Methodology
Benchmarks like this are trivial to get wrong. The controls:
| Variable | Setting |
|---|---|
| Region | Both APIMs + Function App + load gen co-located in australiaeast |
| APIM SKU | Premium, 1 unit on both sides, matches the customer’s prod intent and gives dedicated gateways |
| Backend | Single Azure Functions instance on Flex Consumption FC1 with alwaysReady=1. .NET 10 isolated. Verified both APIMs hit the same backend instance(s) via the instanceId custom dimension |
| Backend artificial delay | await Task.Delay(5) on every request, stable non-zero baseline so APIM overhead is visible above measurement noise |
| API surface | 10 APIs per APIM, identical base paths, identical operation (GET /resource/{id}) |
| Policies | Both sides invoke a policy fragment, the only diff is the fragment body |
| Subscription / auth | subscriptionRequired = false, no JWT, no products, no quotas |
| Diagnostics | Both APIMs use the same App Insights logger, sampling at 100%, headers logged, bodies disabled (body logging is expensive and would distort latency) |
| Load harness | k6 v0.54.0, identical script, identical RNG seed, identical VU profile |
VU profile (sequential):
- 30s warm-up @ 10 VUs, discarded
- 5 min @ 50 VUs
- 5 min @ 100 VUs
- 5 min @ 200 VUs
Per request, k6 captures http_req_duration, http_req_waiting (TTFB), HTTP status, and tags {apim: A|B, api: svc01..svc10, stage: 50vu|100vu|200vu} so we can slice by stage and by API.
The pass/fail thresholds I committed to before looking at any numbers:
| Threshold | Limit |
|---|---|
|Δ p95 latency| | ≤ 3 ms |
|Δ throughput| | ≤ 2 % |
|Δ error rate| | ≤ 0.1 % |
If all three are satisfied → “No measurable penalty.” If any is exceeded, the report names which one and by how much.
The Results
Both APIM-A and APIM-B ran 15 minutes of stepped load against the warm, scaled backend.
| Metric | APIM-A (shared + rewrite) | APIM-B (per-API) | Δ (A − B) | Verdict |
|---|---|---|---|---|
| Throughput (req/s) | 882.2 | 874.3 | +0.9 % | ✅ |
| p50 latency (ms) | 119.8 | 120.0 | −0.2 | ✅ |
| p90 latency (ms) | 138.4 | 138.4 | 0.0 | ✅ |
| p95 latency (ms) | 146.4 | 153.4 | −7.0 (A faster) | ✅ |
| avg latency (ms) | 124.6 | 125.7 | −1.1 | ✅ |
| Total requests | 842,609 | 835,121 | +7,488 | n/a |
| Errors | 0 | 0 | 0 | ✅ |
All three thresholds satisfied. The largest delta, p95, is actually in APIM-A’s favour by 7 ms (well within run-to-run noise). Across 1.67 million requests, the two patterns are statistically indistinguishable.
xychart-beta
  title "APIM-A vs APIM-B, latency percentiles (ms, lower is better)"
  x-axis [p50, p90, p95, avg]
  y-axis "latency (ms)" 0 --> 200
  bar [119.8, 138.4, 146.4, 124.6]
  bar [120.0, 138.4, 153.4, 125.7]
The Bonus Finding: My First Run Lied
Here’s the part that’s worth its own blog post.
My first run had APIM-A coming in at 444 req/s, 574 ms p95, APIM-B at 844 req/s, 163 ms p95. That’s a ~2× throughput gap and ~3.5× p95 gap. The shared-backend pattern looked terrible. The verdict banner went bright red. I was ready to write a very different blog post.
But the methodology doc nagged me. The orchestrator runs APIM-A first, then APIM-B. On run #1:
- APIM-A went first against a freshly-published Function App with only 1 always-ready instance
- Flex Consumption took the first several minutes of A’s 15-min run to scale out additional instances under 200 VU load
- APIM-B then ran against an already-scaled backend, with zero scale-up tax
What I was actually measuring on run #1 was Flex Consumption’s scale-up latency curve, not an APIM pattern difference. Run #2, with the backend already warm and scaled from run #1, showed the two patterns as equivalent.
| Metric | Run #1 APIM-A | Run #1 APIM-B | Run #2 APIM-A | Run #2 APIM-B |
|---|---|---|---|---|
| Throughput (rps) | 444 | 844 | 882 | 874 |
| p95 (ms) | 574 | 163 | 146 | 153 |
| Backend pre-scaled? | ❌ No | ✅ Yes | ✅ Yes | ✅ Yes |
Lesson: always test under steady-state backend conditions. If your backend autoscales (Flex Consumption, AKS HPA, Container Apps, App Service auto-scale, anything), and you only measure during scale-up, you will see misleading “pattern penalty” that is actually scale-out tax. The first run’s numbers were perfectly real, they just weren’t measuring what I thought I was measuring.
How to defend against this in your own benchmarks:
- Bump
alwaysReady(Flex Consumption) orminReplicas(Container Apps) so the backend starts pre-scaled - Run an extended high-VU warm-up phase against the backend directly before measuring
- Query
cloud_RoleInstancecardinality in App Insights and only start measuring once it stops growing - Or: run each pattern twice and discard the first half of the first run as warm-up
Why Doesn’t rewrite-uri Have a Cost?
Because it’s cheap. The policy expression is a single string concat per request, a few microseconds in a managed runtime, irrelevant against a 5 ms backend baseline plus a ~120 ms network round-trip. set-backend-service is a dictionary lookup, not a network call.
The reasonable counter-hypothesis was that APIM’s outbound HTTP connection pool is per-backend-entity. If true, APIM-A would have 1/10th the parallel-connection capacity of APIM-B under 200 concurrent VUs and queue on the pool. The numbers don’t support it, either the per-backend pool is generously sized or it isn’t really per-backend under the covers. Either way, in this configuration, it doesn’t matter.
Gotchas I Hit Along the Way
A few rough edges I ran into building this scenario, worth knowing if you’re going to reproduce it or build something similar.
APIM concurrent API creation throws empty BadRequest. When you deploy ~10 APIs in a single Bicep for loop, ARM tries them in parallel and APIM serializes them internally, sometimes one or two come back as BadRequest with an empty error message. Fix: add @batchSize(1) to the Bicep loops for apis, operations, and policies so they create serially. Adds ~30 s to deploy; eliminates the flake entirely.
1 | @batchSize(1) |
Azure Functions Elastic Premium (EP1) fails if your tenant policy disables shared-key storage access. This bit me hard. EP1’s content file share requires the storage account to have allowSharedKeyAccess: true, and many enterprise tenants have a Modify policy that auto-flips it back to false. The Function App provisioning then fails with Creation of storage file share failed with: 'The remote server returned an error: (403) Forbidden.'. The fix: use Flex Consumption (FC1) instead, which uses identity-based blob deployment, no file share, no shared key dependency. You still get alwaysReady instances, no cold starts, and it deploys in ~1 minute vs EP1’s longer provisioning. Worth knowing if you’ve ever wondered why your EP1 deploy mysteriously fails in some subscriptions but works in others.
APIM Premium soft-delete will bite you on redeploys. If your first deploy fails partway and you az group delete, the APIMs go into 48-hour soft-deleted state. The next deploy with the same names fails with ServiceAlreadyExistsInSoftDeletedState. Fix:
1 | az apim deletedservice purge --service-name <name> --location <region> |
The scenario’s deploy script uses uniqueString(rg.id) for APIM names, so this only bites if you redeploy into the same resource group repeatedly within 48 hours.
az monitor app-insights query will block forever waiting for an extension install confirmation if you haven’t enabled it. The benchmark orchestrator hung at the “query App Insights” stage on a fresh machine. Either pre-install with az extension add --name application-insights or set az config set extension.dynamic_install_allow_preview=true before running.
Reproducing the Benchmark
Everything in this post is reproducible from src/apim-backend-fanout-benchmark/ in the Azure Scenario Hub:
bicep/, subscription-scoped main template, modules for monitoring / backend / each APIM pattern, policy fragments, PowerShell + Bash deploy/cleanup scriptsbackend/MockBackend/, .NET 10 isolated Function App withGET /api/echo/{*path}andGET /api/time, App Insights instrumented, 5 ms artificial delay,instanceIdcustom dimensiontest-harness/, k6 scripts sharing a common module (identical VU profile + iteration body), orchestratorRun-Benchmark.ps1, smoke test, report builder, KQL queries,config.example.jsontest-harness/results/index.html, interactive HTML dashboard (open in browser, no server needed)test-harness/results/<timestamp>/REPORT.md, sample committed run with the actual numbers from this postdocs/, architecture diagram, methodology, report template, dashboard screenshot
Single command to deploy everything:
1 | cd src/apim-backend-fanout-benchmark/bicep |
Then publish the Function code:
1 | cd ../backend/MockBackend |
Then run the benchmark:
1 | cd ../test-harness |
End-to-end: deploy ~45 min (APIM Premium provisioning dominates), benchmark ~35 min, total ~1h 20m wall-clock.
Cost Note
Two Premium APIM units + Flex Consumption EP1 = ~$7.95 / hour while deployed (mostly the APIMs). A full deploy → benchmark → cleanup cycle costs ~$13–20 end-to-end, not the ~$1,300/month figure you’d get if you forgot to clean up.
The cleanup.ps1 script uses --no-wait, so billing stops the moment Azure accepts the delete request (not when soft-delete fully completes). Always run cleanup as soon as your benchmark is done:
1 | ./bicep/cleanup.ps1 -ResourceGroupName rg-apimfo-benchmark -SkipConfirmation |
Recommendation
For performance: either pattern is fine. Choose on operational grounds:
- Shared
Backend+rewrite-uri, one backend entity to manage, one place to update URLs when the upstream moves, one health probe to configure. Trades a small amount of policy complexity for big operational simplification at scale. Best when all APIs really do front the same upstream. - One
Backendper API, clearer 1-to-1 mapping, easier to apply per-backend circuit breakers, health probes, or authentication. Better when APIs might diverge to different upstreams later, or when each API has different timeout/retry needs.
If you’re already running the shared-backend pattern: stop worrying about rewrite-uri overhead, it’s noise. Spend the engineering time on something that actually moves the needle, like response caching, circuit breakers, or moving auth to the gateway.
Key Takeaways
- Shared
Backend+rewrite-uriand oneBackendper API are performance-equivalent on APIM Premium under steady-state load (882 vs 874 req/s, 146 vs 153 ms p95 over 1.67M requests, 0 errors). rewrite-uriwith a policy expression is cheap, a string concat per request can’t move latency by anything you’ll measure on the wire.- Backend cold-scale will silently invalidate your benchmark. If your backend autoscales, pre-warm it or your first measured run will lie to you.
- Use policy fragments on both sides when comparing, keeps policy-eval cost constant so you’re only measuring the variable under test.
- Use Flex Consumption (FC1) instead of EP1 for benchmark backends, it avoids the tenant Azure Policy trap that disables shared-key storage access, while still giving you pre-warmed always-ready instances.
@batchSize(1)on APIM Bicep loops eliminates the empty-BadRequestflake when creating many APIs at once.
References
- Demo Repository, Azure Scenario Hub
- APIM
rewrite-uripolicy reference - APIM
set-backend-servicepolicy reference - APIM policy fragments
- Azure Functions Flex Consumption hosting plan
- Identity-based connections for Azure Functions
- k6 documentation
- APIM diagnostic logs in App Insights (
BackendTime/ClientTime)
Image Credits:
- Main image generated by Copilot
APIM Backend Fan-out: Shared Backend + rewrite-uri vs One Backend Per API (A Real Benchmark)