AI Engineering Coach: Measure How You Actually Code with AI
🎯 TL;DR
AI Engineering Coach is an open-source VS Code extension from Microsoft that reads the local session logs your AI coding assistants already write, then turns them into a private analytics dashboard. It scores your prompting habits, flags anti-patterns, measures your AI-generated output, and surfaces repeated prompts you could promote into reusable skills.
It’s harness-agnostic (Claude Code, GitHub Copilot, Copilot CLI, Codex, OpenCode, and more), runs 100% locally, and does not cost you extra tokens for its core analytics. Think of it as a Strava for the way you work with AI.
⚡ In a hurry? Jump to the install steps, then come back for the why.
The question nobody is measuring
Most of us now reach for an AI coding assistant before we reach for the keyboard. GitHub Copilot, Claude Code, Codex, Gemini CLI. They’ve quietly become the default surface for writing software. But here’s the uncomfortable question I kept coming back to:
Am I actually getting better at this, or am I just using it more?
We obsessively measure the AI: token counts, model benchmarks, latency. We almost never measure ourselves: the quality of our prompts, how often we review what the model generated before shipping it, whether we keep re-typing the same instructions, whether our repos even give the agent enough context to succeed.
That’s the gap the AI Engineering Coach fills. It doesn’t write code for you. It holds up a mirror to how you write code with AI, and that distinction is the whole point.
flowchart LR
    You([You, coding with AI]) -->|prompts · edits · tool calls| Tools["AI coding tools
Copilot · Claude Code · Codex · ..."]
    Tools -->|already write| Logs[("Local session logs
on disk")]
    Logs --> Coach["AI Engineering Coach
reads, never writes"]
    Coach -->|reflects back| Insights["Prompt quality · anti-patterns
output · reusable skills"]
    Insights -.->|so you level up| You
    style Coach fill:#cce5ff,stroke:#1f6feb,stroke-width:2px,color:#000
    style Insights fill:#e6ffed,stroke:#2da44e,color:#000
    style Logs fill:#fff4c2,stroke:#b7950b,color:#000
The loop nobody closes: your tools already write the logs. The Coach just reads them back to you, so the feedback finally points at you, not the model.
What it is
AI Engineering Coach is an open-source VS Code extension built by a group of Microsoft engineers. Its tagline (“better agentic engineering”) sums up the mission: analyze your AI coding assistant usage across any harness, from one dashboard.
A few framing notes up front:
- It’s MIT-licensed and openly developed on GitHub.
- It’s a community effort by Microsoft employees, explicitly not an official Microsoft product or part of any support offering. You run it as-is.
- It reached ~2,000 GitHub stars within weeks of launch, which tells you the pain point is real.
Where it fits in the “engineering” stack
There’s a useful mental model that’s been circulating in the AI-engineering community, harness engineering as the layer beyond prompts and context:
Prompt engineering, what you ask → Context engineering, what you send → Harness engineering, the whole system around the model: instructions, tools, permissions, state, agents, guardrails.
AI Engineering Coach is a tool for that third layer. It measures the system you’ve built around the model, not just the words you type into it.
Why it’s different: it’s not opinionated about your tooling
This is the part I love. The Coach isn’t trying to sell you a particular assistant. It treats every AI tool as a “harness” and ships a dedicated parser for each one. Whatever you’re using, it normalises the logs into a single shared data model so you get one dashboard across all of them.
Here’s what it reads today:
| Harness | What it parses | Where the logs live (macOS / Linux) |
|---|---|---|
| Local Agent (VS Code + Insiders) | GitHub Copilot chat-panel logs: requests, responses, model, tokens, tool calls, file refs, terminal commands | VS Code workspaceStorage/ |
| Claude / Claude Code CLI | Structured conversations, tool use, file edits, sub-agent (sidechain) roll-ups, token + cache metadata | ~/.claude/projects/ |
| Codex | OpenAI Codex terminal agent: prompts, completions, tool interactions | ~/.codex/sessions/ |
| OpenCode | Open-source multi-backend terminal tool session logs | ~/.local/share/opencode/ |
| GitHub Copilot for Xcode | Copilot Chat logs from a SQLite database | ~/.config/github-copilot/xcode/ |
| GitHub Copilot CLI | Session-state + history, model usage, per-model token metrics at shutdown | ~/.copilot/session-state/ |
A candid note on Gemini CLI: if you live in Gemini CLI, set expectations correctly: it isn’t a supported harness yet. The repo’s Supported Tools page currently documents exactly the six parsers listed above, and Gemini CLI isn’t among them, so your Gemini sessions won’t show up in the dashboard today. The encouraging part: the architecture is genuinely pluggable. The terminal-based tools (Claude Code, Codex, OpenCode) are wired up through a small
EXTERNAL_HARNESSEScollector list inparser-harnesses.ts, and a terminal agent like Gemini CLI would slot in the same way: a new parser plus one registry entry, not a rewrite. The project’s stated intent is genuinely “any harness, one dashboard.” Worth watching the repo (or opening a PR) if Gemini coverage matters to you.
Because everything lands in a unified Session model, the Output and Patterns views can compare across tools, e.g. how much code you generate with Claude Code vs. Copilot, or which model you lean on for which kind of task.
How it actually works (and why it won’t blow up your token bill)
This is the section I’d want answered before installing anything that touches my AI sessions, so let’s be precise. There are two questions people get nervous about: Is this sending my code somewhere? and Is this going to quietly burn tokens and cost me money? The answers are no and no, for the core product.
The data pipeline, end to end
Your AI tools are already writing detailed session logs to disk every time you use them. The Coach simply reads those files that already exist and turns them into analytics. Nothing is re-run. Your prompts are not replayed against a model.
flowchart LR
    subgraph LOCAL["🖥️  Your machine, nothing leaves it"]
        A["AI tool session logs
(already on disk)"] --> B["Harness parsers
parser-claude.ts
parser-vscode.ts
parser-xcode.ts ..."]
        B --> C["Unified Session model
Session + SessionRequest"]
        C --> D["Parse / warm-up workers
(local worker threads)"]
        D --> E["45 detection rules
+ metrics engine"]
        E --> F["Local cache"]
        F --> G["Preact dashboard
(VS Code webview)"]
    end
    G -. "RPC bridge
(webview has NO direct file access)" .-> D
Walking through it:
- Discovery. On first run the extension scans the known local log directories for each supported harness. It only looks where those tools actually store data.
- Parsing. A specialised parser per harness reconstructs each session. (VS Code stores state as fragmented JSONL and is rebuilt by replaying incremental patches; Claude Code’s sub-agents are rolled up into their parent session; large base64 image blobs are stripped out to avoid memory blow-ups.)
- Normalisation. Everything becomes a uniform
Session→SessionRequeststructure, so the analytics don’t care which tool produced the data. - Analysis. Background worker threads run the metrics engine and 45 markdown-defined rules entirely on-device (regex / AST parsing, no network).
- Render. A Preact webview displays the dashboard. Crucially, the UI talks to the backend over an RPC bridge and never gets direct filesystem access, a deliberate security boundary.
The privacy guarantees, in the project’s own words
flowchart TB
    subgraph CORE["Core analytics, always 100% local"]
        R["Read-only:
never modifies your logs"]
        T["No telemetry:
no outbound network calls"]
        P["Local parsing:
runs in on-device worker threads"]
    end
    subgraph OPT["Optional AI features, opt-in only"]
        O["Skill Finder, Context-file review,
Rule compiler"]
        O --> M["Uses the VS Code built-in
Copilot language-model API
ONLY when you click"]
    end
    CORE -. "you can stop here and get
the full dashboard" .-> OPT- Read-only. The extension never edits your session files or config.
- No proprietary telemetry. It doesn’t phone home or collect usage data.
- Local analysis. All parsing and analytics run on your machine.
So where do the costs actually come from? (The honest answer)
The entire core dashboard (scores, trends, anti-patterns, output measurement, timelines) costs you zero extra tokens. It’s reading data your tools already paid to generate. There is no separate API key, no hidden model call, no surprise bill.
A handful of optional, opt-in features are AI-powered: the Skill Finder, the Context-file review, and the AI rule compiler. When (and only when) you explicitly invoke those, they use the VS Code built-in Copilot language-model API, i.e. your existing Copilot subscription/entitlement, not a new paid endpoint. If you never click them, no model is ever called. That’s the whole anxiety, defused: observability is free and local; the few generative extras politely reuse the Copilot you already have.
The dashboard tour
The extension is organised into four sections (Observe, Measure, Improve, Level Up), each with a handful of pages. Here’s the lay of the land.
mindmap
  root((AI Engineering
Coach))
    Observe
      Dashboard
      Timeline
      Coding Moments
    Measure
      Output
      Burndown
      Patterns
    Improve
      Anti-Patterns
      Rule Editor
      Rule Playground
      Data Explorer
      Skill Finder
      Context Health
    Level Up
      Learning Center
      Achievements
      Agentic SDLC
      Share
Observe: what’s happening
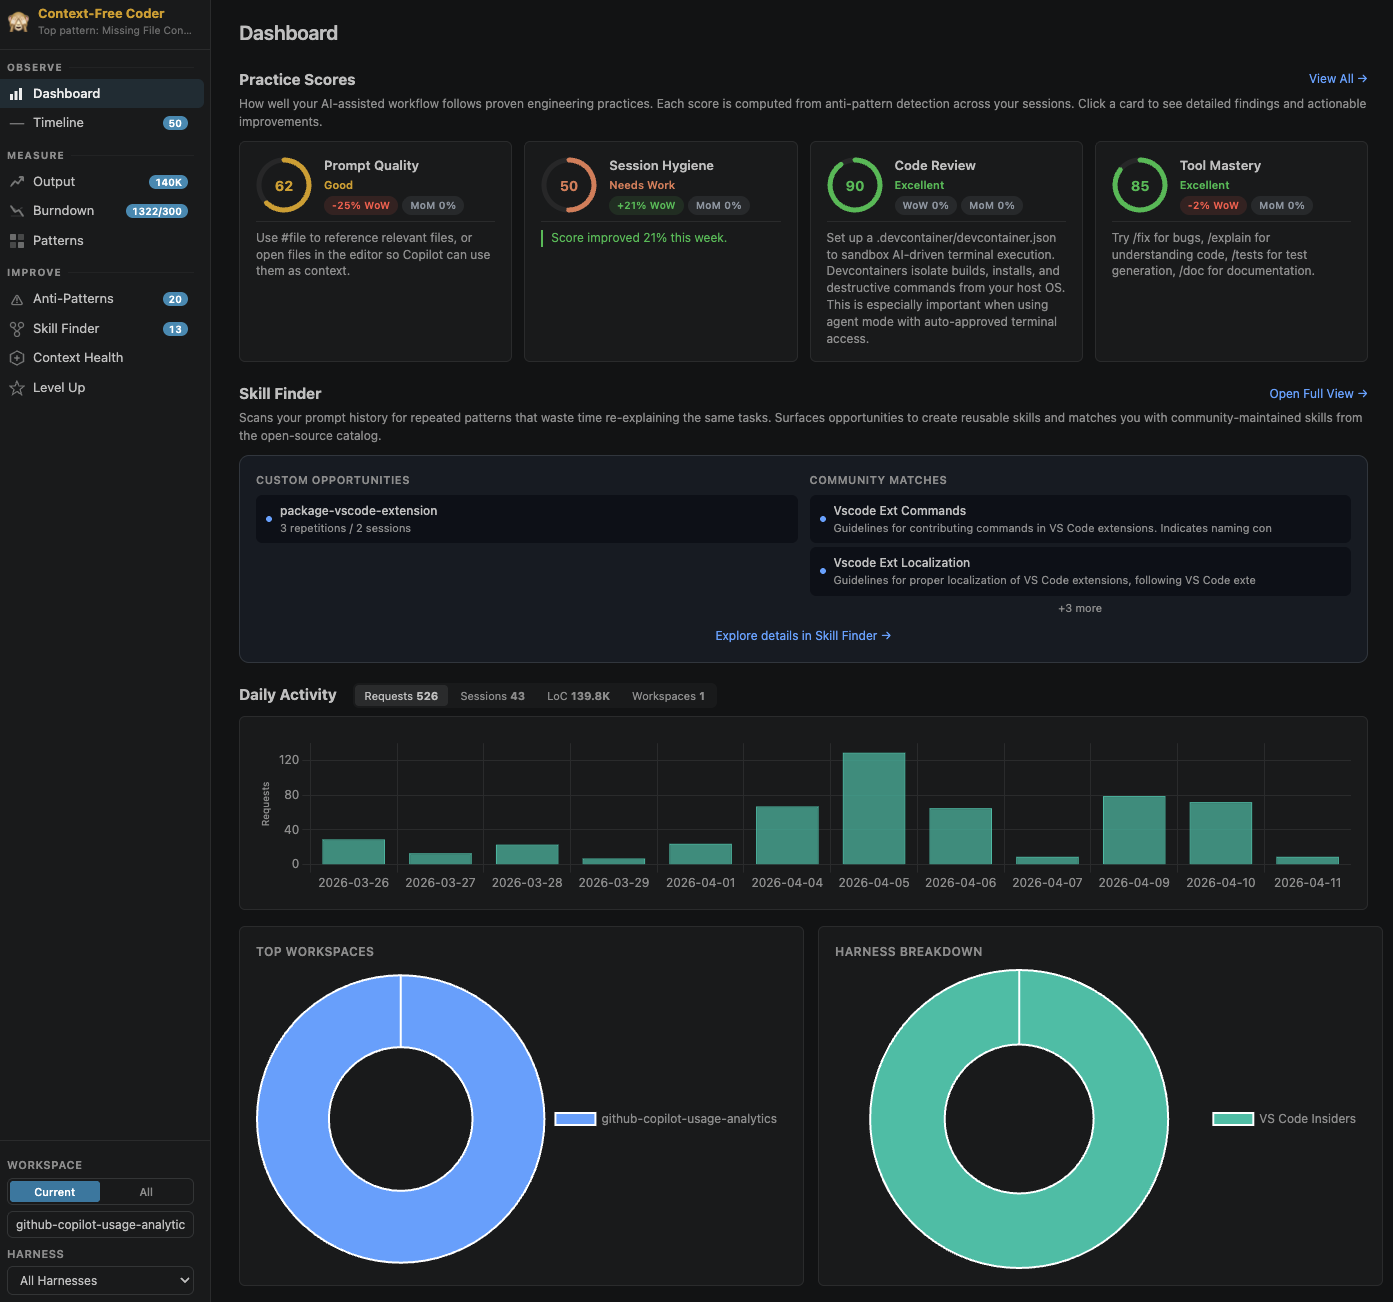
Dashboard. Your headline view: practice scores with week-over-week and month-over-month trends, a daily activity chart broken down per harness, and top-workspace stats.
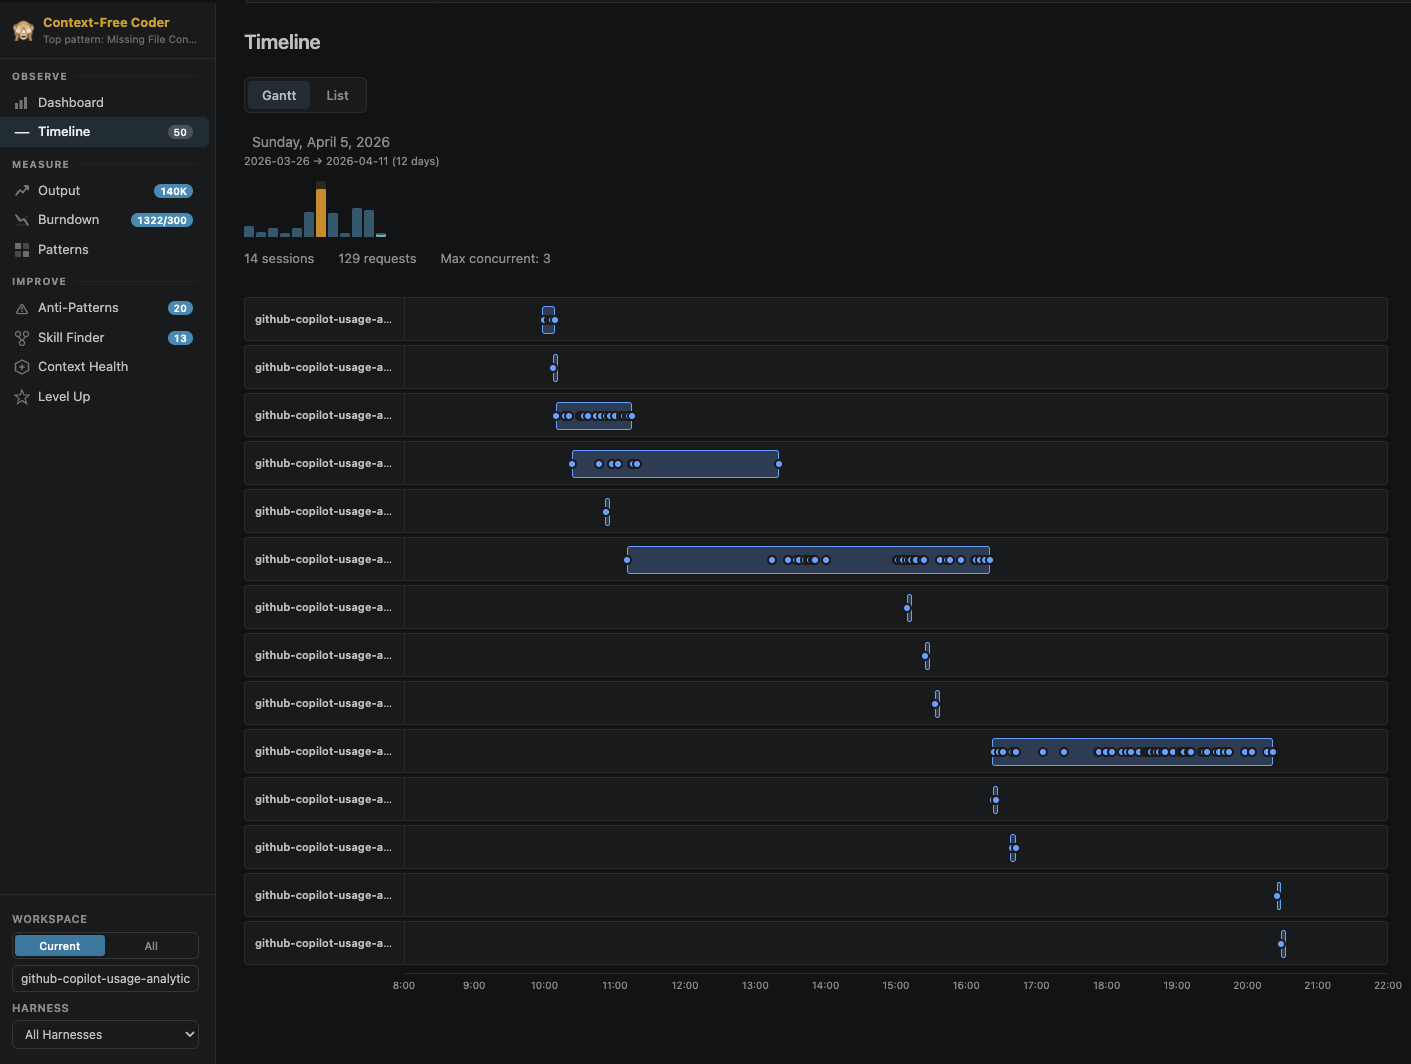
Timeline. A Gantt-style timeline of every AI session, with per-day drill-down and overlap detection, going back months.
Coding Moments. A screenshot gallery and “story reels” captured from your coding sessions, filterable by workspace.
Measure: how much
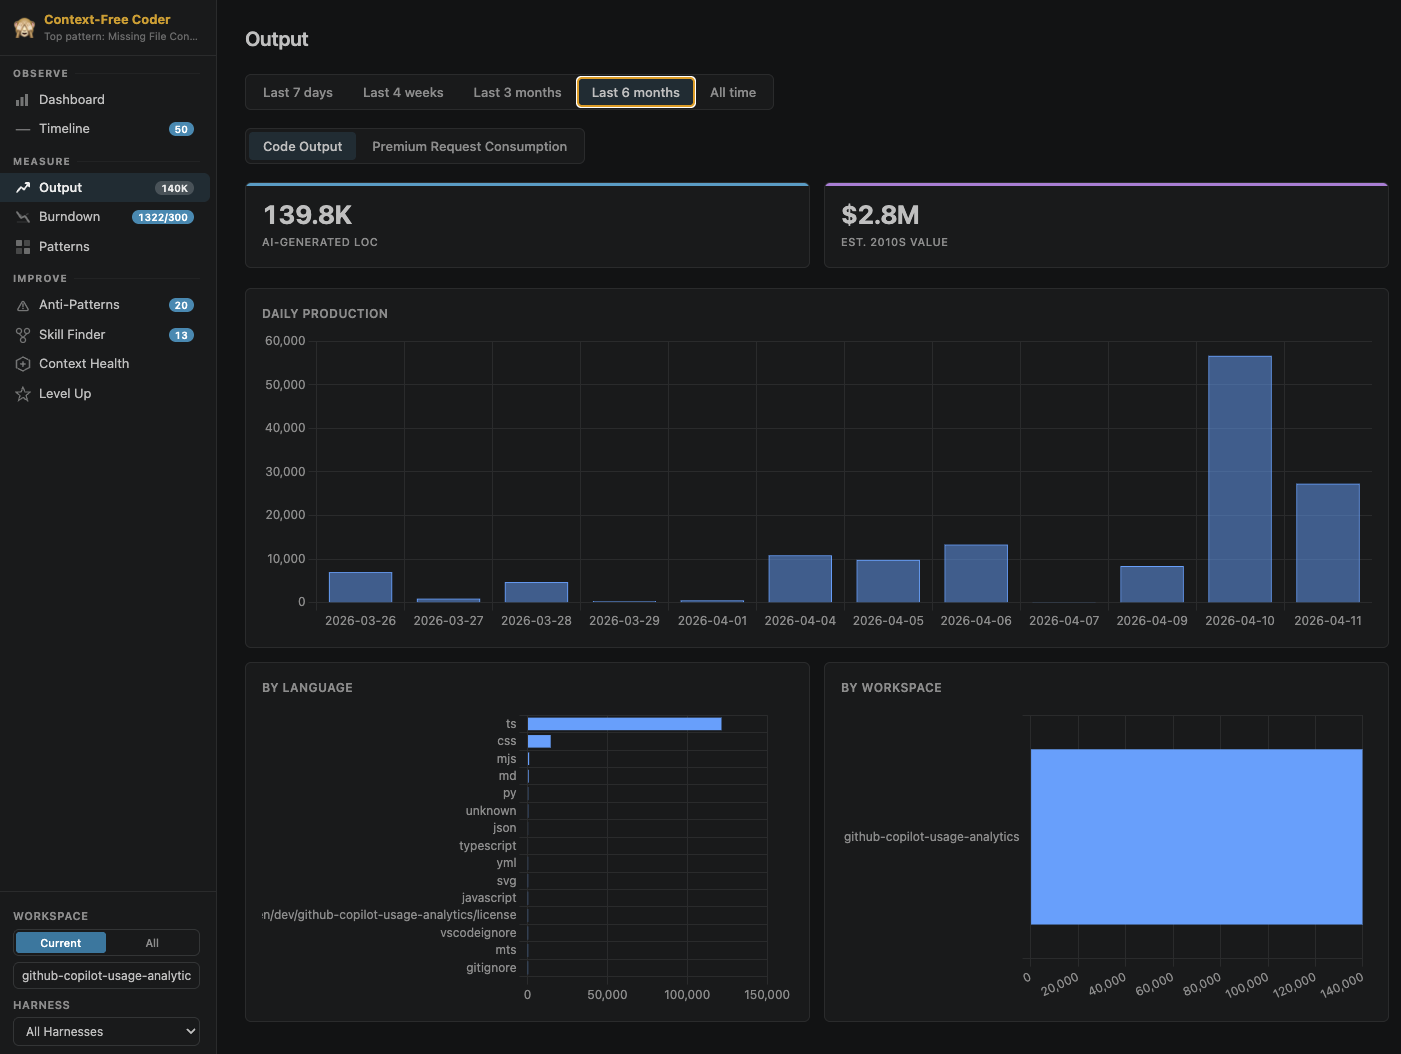
Output. AI-generated code volume by language and workspace, plus a model-usage table with per-model token breakdowns.
Patterns. A 7×24 activity heatmap and work-life-balance signals (when is your AI coding actually happening?).
Burndown. Monthly token-budget progress with projections.
One honest caveat on the Measure section: the maintainers note in the README that, in the current build, the Burndown page is temporarily disabled and the per-model token-usage tab on the Output page is temporarily hidden. So if you install today and don’t see those two, that’s expected, not a broken setup. The code-output and language/workspace breakdowns are live.
Improve: the coaching
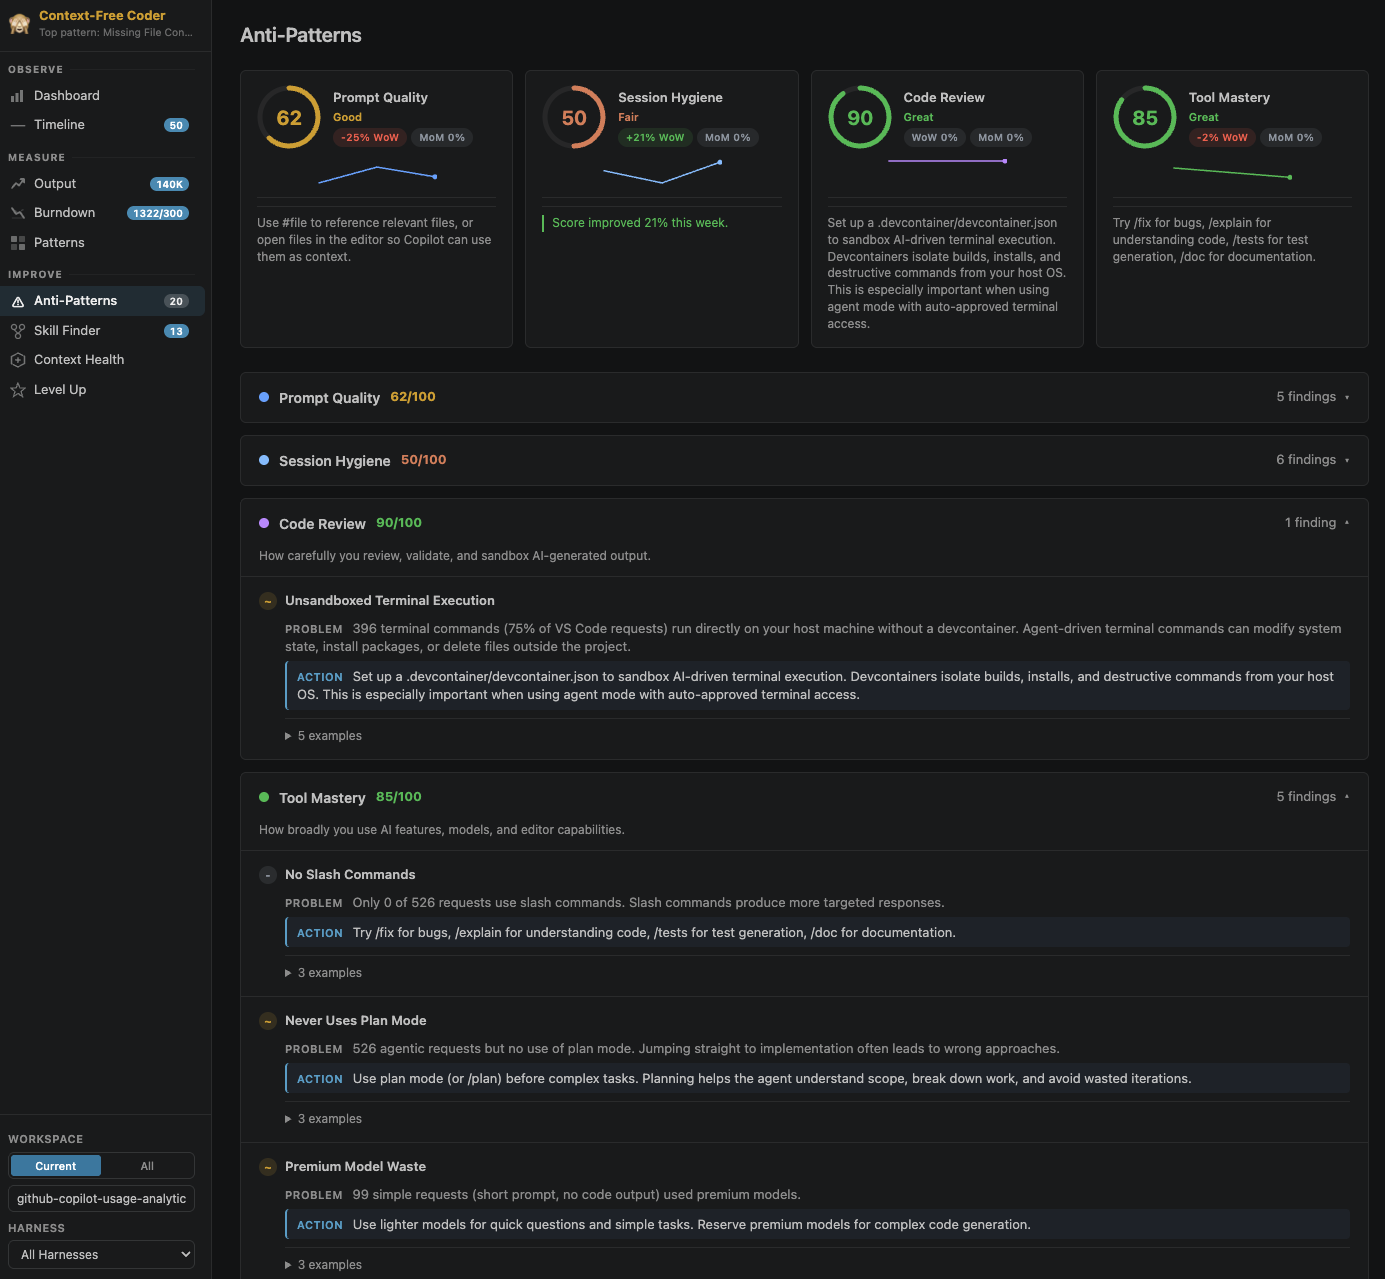
This is the heart of it. Anti-Patterns gives you five practice-score cards (Prompt Quality, Session Hygiene, Code Review, Tool Mastery, Context Management), each with severity ratings, concrete actions, and example prompts, backed by 45 editable detection rules.
The rules aren’t a black box. They’re markdown files you can read, edit, and live-test:
- Rule Editor. Author and tune rules visually or as raw markdown, and test against your own data.
- Rule Playground. An interactive REPL for the rule DSL with a field browser and function catalogue.
- Data Explorer. Browse session fields, view distributions, run ad-hoc filters.
Rules follow a trust workflow so you stay in control of what runs against your data:
stateDiagram-v2
[*] --> Pending: rule created / imported
Pending --> Review: inspect the logic
Review --> Approved: you approve it
Approved --> Active: reload, rule runs on your data
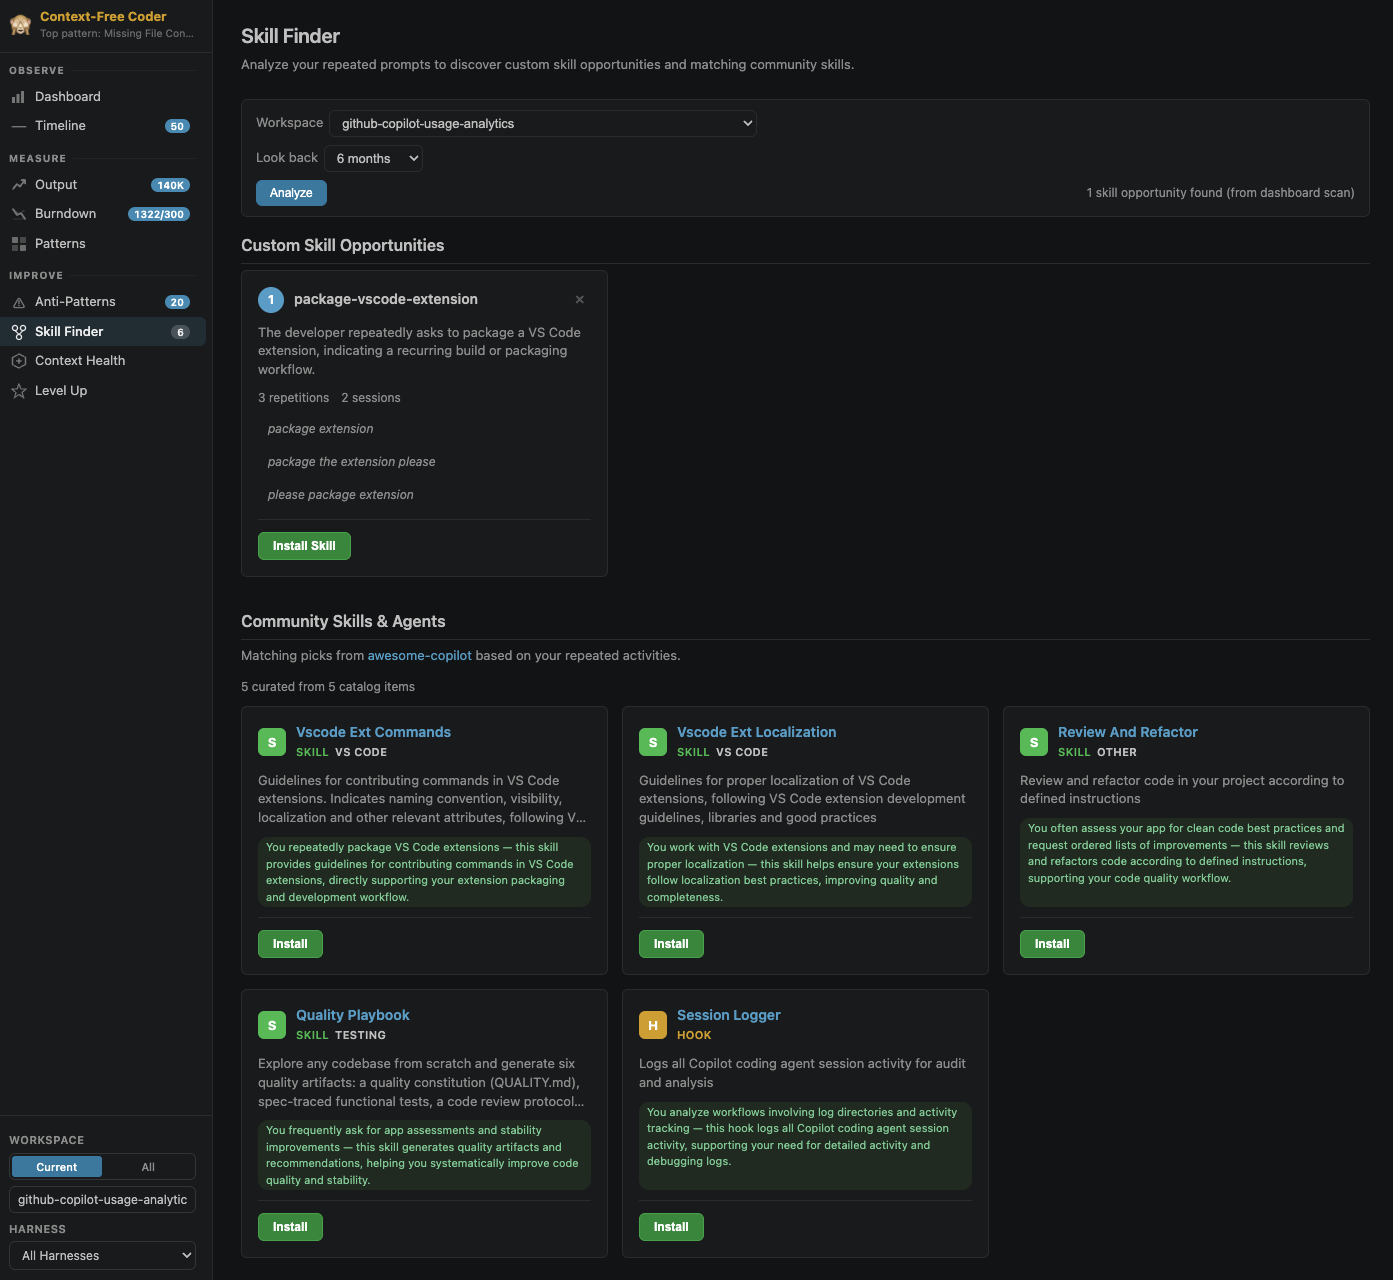
Active --> Pending: any edit revokes trustSkill Finder scans your prompt history for repeated patterns and suggests turning them into reusable custom skills, and even matches them against a community catalogue of skills and agents.
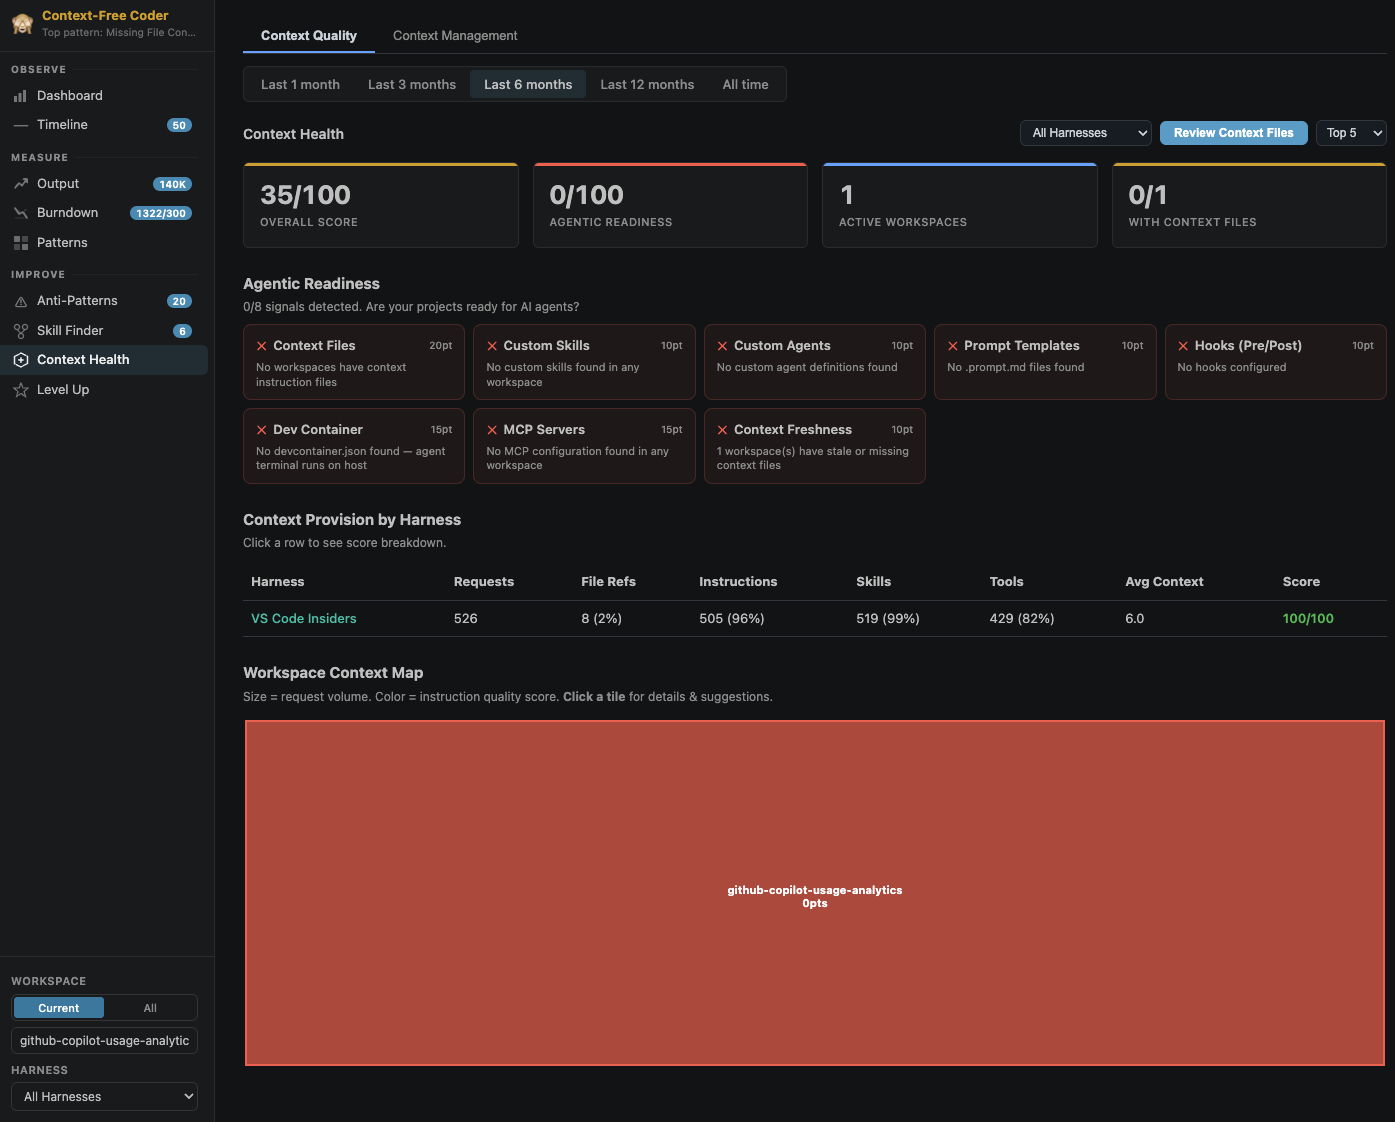
Context Health scores how agent-ready your repos are: an overall context score, an agentic-readiness checklist, a per-harness context-provision breakdown, a workspace context map (a treemap coloured by instruction quality), and an AI-powered review of your instruction files (AGENTS.md, CLAUDE.md, copilot-instructions.md, etc.).
Level Up: the gamified bit
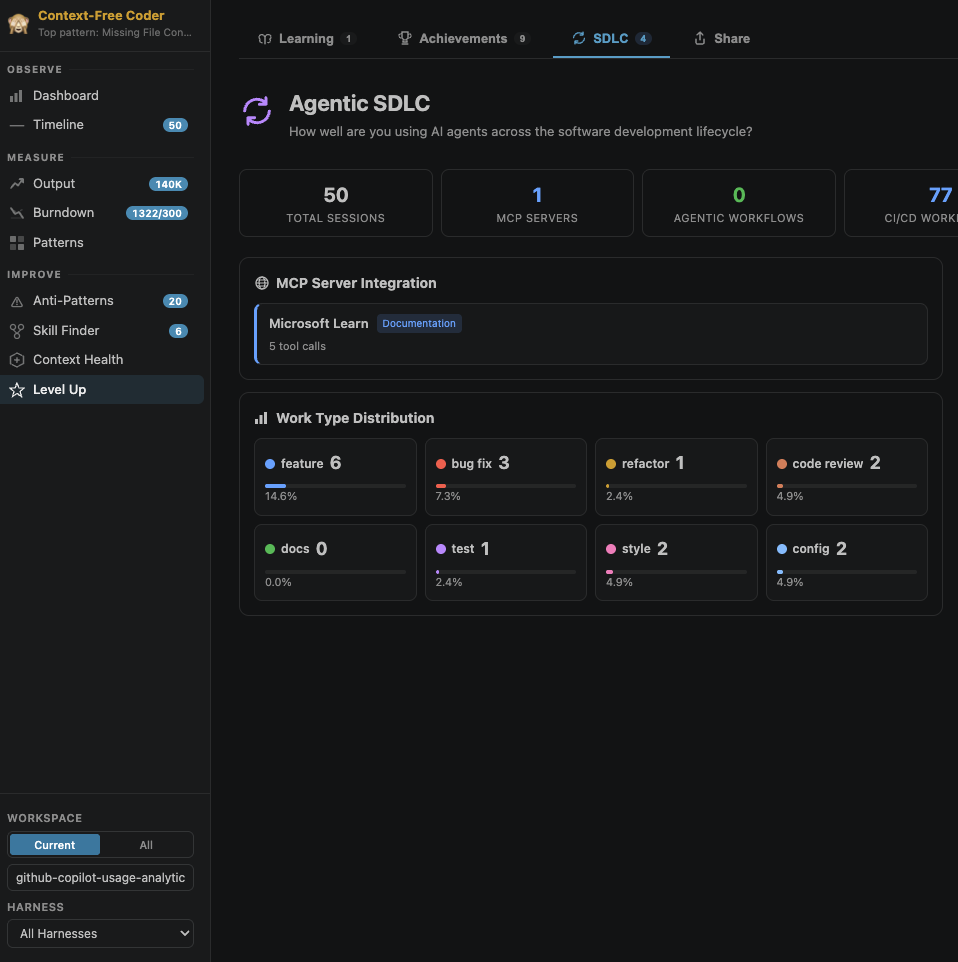
Learning Center generates personalised quizzes and code-comparison rounds from your actual usage. Achievements add XP-based progression (Bronze → Silver → Gold → Diamond). Agentic SDLC tracks how you use AI across the full software lifecycle, not just code generation, but planning, testing, review, and docs.
Share lets you export a shareable stat card plus Markdown/JSON summaries.
Bonus: it’s also a chat participant
The dashboard gets the spotlight, but the extension also registers an @aicoach participant in VS Code’s Copilot Chat, with slash commands like /summary, /improve, /compare, and /flow. So you can stay in the chat panel and just ask (“how was my AI usage this week?” or “compare my tools”) and get an answer grounded in your own local session data, no dashboard navigation required.
The benefits, distilled
If I had to argue the case for installing it on a Monday morning, it’s these:
- It turns a habit into something you can inspect. You can’t improve what you don’t measure, and right now almost nobody measures their own AI usage.
- It’s a single pane of glass across every harness. Stop guessing which tool you actually lean on; see it.
- It catches expensive bad habits. Over-reliance on one model, mega-sessions that never get compacted, generated code shipped without review, repos with thin context that set the agent up to fail.
- It converts repetition into leverage. The Skill Finder is genuinely clever: your most-repeated prompts are exactly the ones worth promoting into reusable skills.
- It makes your repos agent-ready. Context Health audits the instruction files that every modern harness reads, so the next agent that touches your codebase starts with a better brief.
- Zero marginal cost and zero data exposure. Local-only, read-only, no telemetry, no extra tokens for the core experience. The barrier to trying it is essentially nil.
- It’s transparent and forkable. 45 rules in plain markdown, MIT-licensed, PRs welcome. You can tune the coaching to your team’s standards.
A fair counterpoint, because I like honest blogging: tools like this only pay off if the reflection turns into changed behaviour. The dashboard is the easy part; acting on what it shows is the work. Treat it as a coach, not a scoreboard.
How to install it
Quick reality check, because this tripped me up too: the extension isn’t on the VS Code Marketplace or the project’s Releases page. The repo says it plainly, “The extension is not published to a marketplace or Releases page, so you build the .vsix yourself and install it.” So there is nothing to download. You build the .vsix once (about two minutes, mostly copy-paste), then install it. Here’s the fast way.
Option A: One block that builds and installs (recommended)
Prerequisites: git, Node.js + npm, and VS Code 1.120+ with the code command on your PATH. If code isn’t found, run Shell Command: Install 'code' command in PATH from the command palette first.
Windows (PowerShell):
1 | # Clone, build, and install in one go |
macOS / Linux (bash):
1 | # Clone, build, and install in one go |
npm ci installs dependencies, npm run package produces the .vsix, and the last line installs that freshly built file. Reload VS Code when it prompts, and you’re done.
Option B: Build, then drag-and-drop (no install command)
Prefer a visual install? Run the first four lines from Option A (clone, cd, npm ci, npm run package), then skip the last command and drag the generated ai-engineer-coach-*.vsix from the repo folder straight onto your VS Code window. Or press Ctrl/Cmd+Shift+P, type Install from VSIX, and pick the file.
Option C: Build in a Dev Container (no local Node.js)
No Node on your machine? Use the bundled dev container (needs the Dev Containers extension plus Docker or Podman):
- Clone the repo and open it in VS Code.
- Run
Dev Containers: Reopen in Containerfrom the command palette. - In the container terminal, build the VSIX:
1
2
npm ci
npm run package - Drag the generated
.vsixonto VS Code, or runExtensions: Install from VSIX…and pick the file.
💡 Once the project publishes to a marketplace or the Releases page, a one-click install (or download and drag-drop) becomes the shortcut. Until then, building it yourself is the only way in.
First run: finding the dashboard
After VS Code reloads, a new graph icon appears in the Activity Bar, the strip of icons down the left edge where Explorer and Source Control live. That icon is the Coach. Click it to open its side panel with the Dashboard view.
There are two ways to reach the dashboard:
- Click the graph icon in the Activity Bar, or
- Open the command palette with
Ctrl/Cmd+Shift+Pand runAI Engineer Coach: Open Dashboard.
Once it’s open, navigate the pages from the sidebar and use the workspace and harness filters at the bottom-left to slice the data. After more coding sessions, run AI Engineer Coach: Reload Data to pick up the latest.
The nice part: there’s no setup and no waiting. Because you probably already have months of session logs sitting on disk, the dashboard is populated the moment you first open it, no warm-up period. If the graph icon doesn’t appear, it may be tucked under the ... overflow at the bottom of the Activity Bar, or a quick Developer: Reload Window will surface it.
sequenceDiagram
    participant You
    participant VS as VS Code
    participant Ext as AI Engineering Coach
    participant Disk as Local log dirs
    You->>VS: Run "Open Dashboard"
    VS->>Ext: Activate extension
    Ext->>Disk: Scan known harness log paths
    Disk-->>Ext: Existing session logs
    Ext->>Ext: Parse + normalise + score (local workers)
    Ext-->>You: Dashboard populated from day one
    Note over You,Ext: Later, "Reload Data" re-parses new sessions
My take
AI Engineering Coach is not another assistant fighting for space in your editor. It’s the feedback loop that’s been missing from the whole AI-coding era. We adopted these tools at breakneck speed and never built the instrumentation to know whether we’re using them well.
For me the value isn’t the charts; it’s the reflection they force. It quietly moves you from “I use AI tools” to “I use AI tools deliberately.” And it does it without sending a byte off your machine or adding a cent to your token bill.
If you write code with AI every day (and at this point, who doesn’t), it’s worth an afternoon to point this at your own logs and see what it tells you. You might be surprised what’s been sitting in your ~/.claude/projects/ folder this whole time.
Key Takeaways
- We measure the AI obsessively and ourselves not at all. AI Engineering Coach closes that loop by reading the session logs your tools already write.
- It’s harness-agnostic: one dashboard across Copilot, Claude Code, Codex, OpenCode, Copilot CLI, and Copilot for Xcode, normalised into a single session model.
- The core analytics are 100% local, read-only, no telemetry, and cost zero extra tokens. Only the opt-in Skill Finder / context review / rule-compiler features call a model, and they reuse your existing Copilot entitlement.
- The coaching is transparent and forkable: 45 anti-pattern rules in plain markdown, a trust workflow, and a playground to tune them to your team’s standards.
- Context Health audits the instruction files (
AGENTS.md,CLAUDE.md,copilot-instructions.md) every modern harness reads, so the next agent that touches your codebase starts with a better brief. - The dashboard is the easy part; acting on what it shows is the work. Treat it as a coach, not a scoreboard.
References
- AI Engineering Coach on GitHub
- GitHub Copilot
- Claude Code (Anthropic)
- OpenAI Codex CLI
- VS Code Language Model API
Image Credits:
- Cover image generated by Copilot
- Dashboard screenshots from the AI Engineering Coach repository
AI Engineering Coach: Measure How You Actually Code with AI
https://clouddev.blog/AI/AI-Engineering/ai-engineering-coach-measure-how-you-actually-code-with-ai/